Geologists draw dozens of types of geologic maps. They want to show the earth as it is deep underground.
A Structure Map
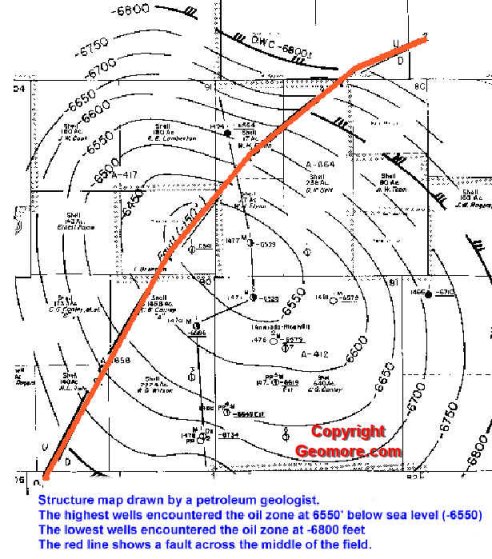
The map below is a hand-drawn structure map. It is drawn on the top of an oil zone that is about 8000 feet deep. The map is about two miles across. It is similar to a contour or topographic map drawn on the surface of the earth. But, this map shows contours of a structure that is more than a mile underground.

Hand-Drawn Structure Map
The petroleum geologist picks the top of the oil zone in every well that is drilled. She knows the elevation of the ground at the drilling site. For example, if the elevation of the ground is 1000 feet above sea level, and the top of the oil zone is found at 7700 feet, she subtracts 7700 feet from 1000 feet to get a subsea elevation of -6700 feet. The well is “spotted” or marked on the map and the subsea value is posted bedside it. Then contour lines are drawn on the map to create her visualization of the underground structure. It takes a lot of practice to draw contour maps and make them look nice.
In the above case, the structure is shaped like a broad dome…or hill….with the top of the hill at -6550 feet below sea level, and the base of the hill at -6800 feet below sea level. So, the top of the hill is about 250 feet higher than the base!
An Isopach Map
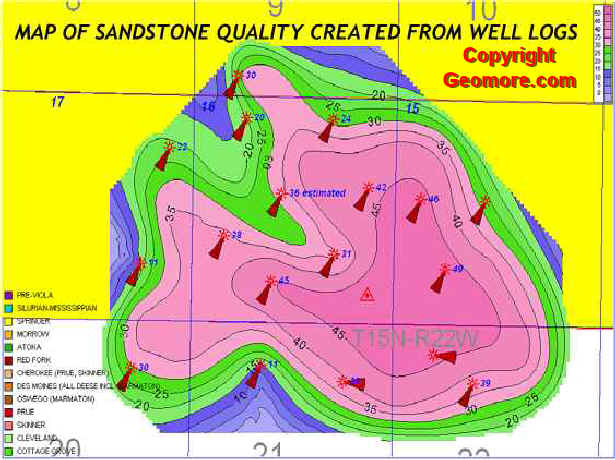
Here is a different type of map called an isopach map, which was constructed over a small gas field. The squares (or sections) are one mile in length on each side. In this map, the petroleum geologist has contoured the thickness of an individual sandstone. This sandstone is about 45 feet thick in the middle, and thins to 20 feet or less around the edges of the gas field.

Isopach Map
Another Isopach Map
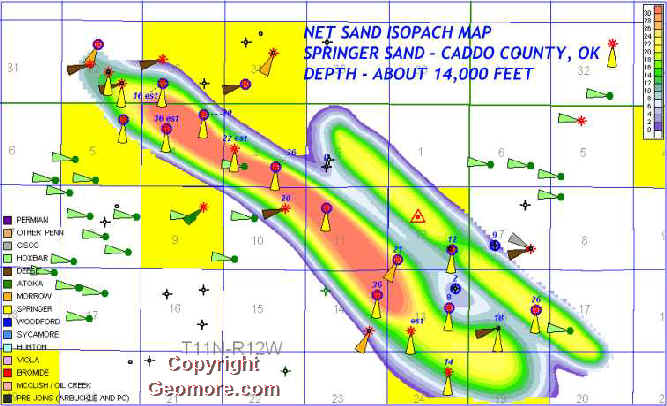
Below is another colorful isopach map. It is contoured on one of the Springer (Pennsylvanian) sands in Oklahoma. This particular sandstone was deposited in the ocean, as a type of sand bar. That gave it a lot of

Springer Isopach Map
porosity, and now it is a pretty nice gas field. The PG made this map by looking at the porosity of the sandstone in the electric logs of all the wells. Then the PG determined how many feet of the sandstone was producible, or pay in each well. That pay amount was posted in blue alongside the wells. Note that some wells have only a couple feet of pay, while wells toward the center have up to 28 feet of pay. This is why your neighbor may have an oil or gas well, and you do not! The squares shown are “sections,” each a mile square, so the length of this sand body or “field” is about six miles. However, it is only a mile or so wide.
A Production Map
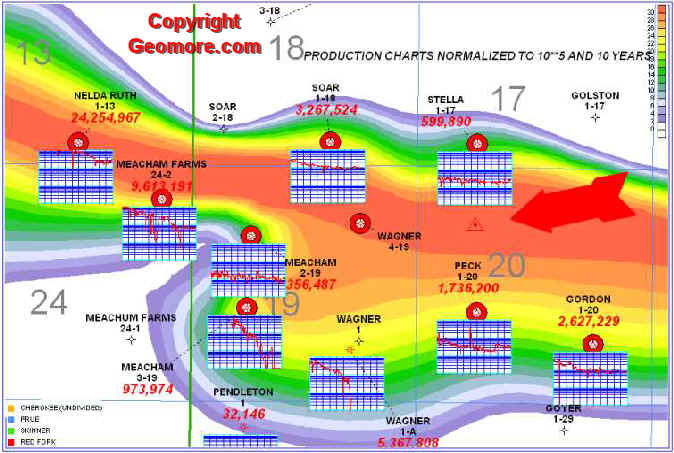
One more map. This one shows an ancient stream or river channel. The sandstone is about 30 feet thick in the middle of the channel. Production charts have been placed on the map. These show graphically how much oil

Production Data Superimposed on Isopach
and gas were produced from each well over the years. The large red numbers show the amount of produced gas. For example, the Soar 1-18 (top middle) has made 3,267,524 thousand cubic feet of gas, or 3.2 billion cubic feet. That’s a good well !
Amount of Gas Abbbreviation used in the Oil Industry
1000 cubic feet of gas = 1 MCF
1 million cubic feet of gas = 1 MMCF or 1000 MCF
1 billion cubic feet of gas = 1 BCF or 1,000,000 MCF
A typical house might use only about 4 MCF of gas per month for heating. Assuming 6 months of heating per year, that’s 24 MCF used per year. That means the Soar has produced enough gas in it’s lifetime to heat 136,000 houses for one year !
