Stratigraphic Cross-Sections
Stratigraphic cross-sections are the first type of cross-section we will cover. They are slightly easier to explain than structural cross-sections, which are the next topic.
“Strat” cross-sections allow the petroleum geologist to see some things more clearly. Geologists make a whole lot of stratigraphic cross-sections as they try to figure out what the rocks are doing and where they are going.
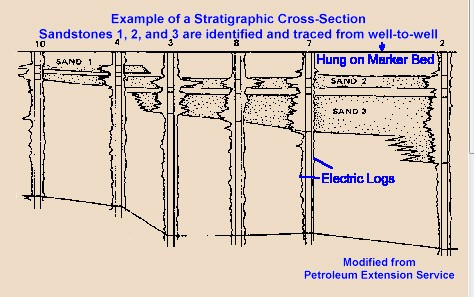
The stratigraphic cross-section shown in Figure 1 illustrates a horizontal view through six wells. Electric logs are laid out in a line with paper and ruler, or a computer.
Constructing the Stratigraphic Cross-Section
The geologist takes a long piece of paper, or a computer, and makes a long, straight horizontal line called a stratigraphic datum. He looks at the electric logs that will go into the cross-section, and identifies a marker bed that he can find on every single well log.
Each electric log is “hung” on the stratigraphic datum line. Hanging the line on the marker-bed stratigraphic datum allows the petroleum geologist to see the relationship of the formations more clearly, and proceed to the important work of connecting them properly. This kind of cross-section does not show a true representation of the vertical depth change between wells. The geologist will need to make a structural cross-section to see that relationship.
The geologist then looks at the various formations she can identify on the electric logs. In this case, several sandstones are visible. She tries to connect the formations so the cross-section will look similar to real geology she has observed on field trips, or studied in school. This process of showing on paper what we think the real world looks like is called “modeling,” because we are making a model of what we might see if we could dig it up! Our models may be good, or they may be bad, but geologists make a lot of models!

Figure 1. Simple Stratigraphic Cross-Section
The most interesting thing about this particular cross-section is the way sand 3 disappears between wells 3 and 4. This is called a pinch-out, and is a very common thing in petroleum geology. This is one of the things that makes geology interesting, puzzling, and challenging!
If the oil or gas is contained only within sandstone 3, the two wells on the left (10 and 4) would be dry holes, because no sand 3 was present.
A Stratigraphic Cross-Section Made with Digital Well Log Images
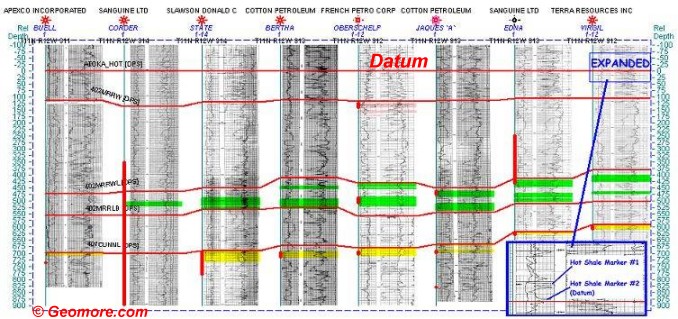
Here is a stratigraphic cross-section (Figure 2) generated using a computer and image files of the well logs. In this case, the petroleum geologist has chosen a “hot” shale (high gamma-ray reading) for the datum . All the well logs are “hung” on the datum. The green and yellow areas represent “pay zones.” These pay zones are intervals the petroleum geologist believes may produce oil or gas. The red bars show where some of the zones have been perforated for production.

Figure 2. Stratigraphic Cross-Section With Well Log Images
A Stratigraphic Cross-Section Made From Digital Well Log Data

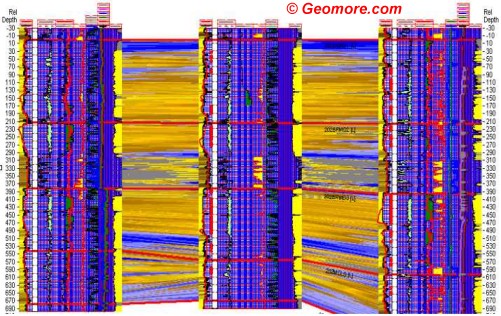
Figure 3. Computer-Drawn Stratigraphic Cross-Section
The next stratigraphic cross-section was generated with a computer using digital well logs (Figure 3). Notice how the rocks are displayed between the well logs as the geologist believes they lie underground. The brighter yellow colors represent the better sand quality in the well. This kind of display is especially useful to help explain things to non-geologists.
