Structural Cross-Sections
Once the petroleum geologist gets electric logs, well samples, or core data from two or more wells, he will make a cross-section. With a structural cross-section, he will attempt to show the various positions of the rock formations as they actually look underground. The geologist knows the elevation above sea level for each of the wells. He wants to show a model of the way the wells would line up if they could be viewed from the side! This is the same as looking at the side of a layer cake that has been cut. When one looks at a cut layer cake, one is looking at a cross-section.
Datums

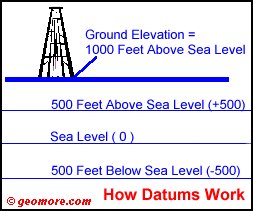
How Datums Work
The geologist will choose a structural datum, or artificial elevation first, depending on the depth of the logs. For example, he chooses a datum that is 500 feet below sea level (-500′). The geologist wants to take his electric logs and “hang” them on the datum so that they are all “hung,” or lined up, on the same datum. The concept of the structural datum is slightly more complicated than the idea of the stratigraphic datum. Understand stratigraphic datums and cross-sections first!
The PG has 4 wells to work with:
- Well #1 has a ground level elevation of +1000 feet (1000 feet above sea level.
- Well #2 has a ground level elevation of +1050 feet.
- Well #3 has a ground level elevation of +1045 feet.
- Well #4 has a ground level elevation of +1060 feet.
The geologist looks at the electric log for each well, and determines where the -500-foot datum will be located on each log.
How It’s Done
Well #1 has a ground level elevation of +1000 feet. In order to get to -500 feet, the geologist must go down the log to a drilled depth of 1500 feet (+1000 – 1500 = -500 feet). She makes a mark on the first log at a depth of 1500 feet. She follows the same method for each of the remaining logs, until they each have a mark on them at the -500-foot datum…wherever it lies on the well log. It will be at a different place on each log.
Then, the -500 datum is drawn as a horizontal straight line on paper, or a computer. The geologist places each log on the paper; he lines them up so the pencil mark on the log lines up with the datum line on the paper.

Correlating Formations on A Cross-Section
After the logs are placed correctly, he draws lines between the formations he believes are the same in each well. On the cross-section at the left, he has picked a “Marker Bed” and the “A Sand.” He draws pencil lines connecting the Marker Bed and the top and bottom of the A Sand.
Notice how the formations picked on the cross-section are tilted. This shows the actual way the formations are tilted in the earth. Rock formations below the surface of the earth are almost never perfectly flat. It is the tilting and and folding of the rock layers that create so many oil and gas traps for the petroleum geologist to find.
A Large Cross-Section
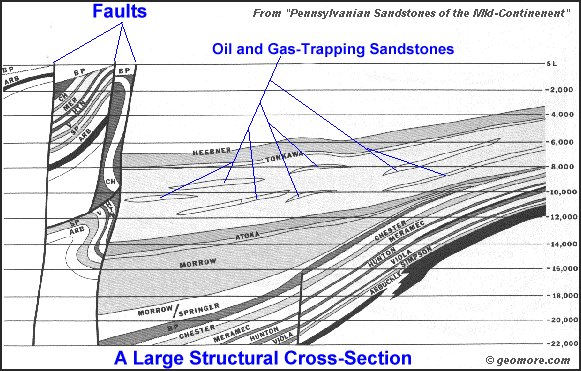
A very large structural cross-section is shown below. When I say “large,” I mean the cross-section covers a large land area. This type of cross-section is more like a “cartoon,” and shows rock layers over a horizontal distance of several hundred miles.

This Cross-Section Is Many Miles Long
Computer Help
Most cross-sections are now generated with computers. This avoids a lot of tedious drafting that was formerly required. The geologist can quickly adjust the datums, or “slip” the logs up and down to make better correlations, and make other changes quickly.
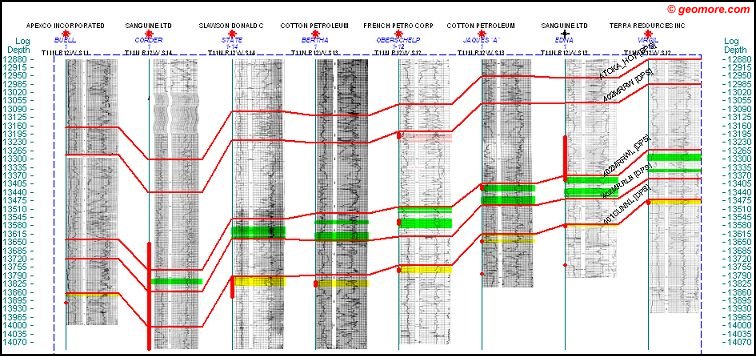
The green and yellow areas on this computer-drawn structural cross-section (hung on the sea-level datum) represent pay zones. These pay zones are intervals the petroleum geologist believes may produce oil or gas. The red bars on the cross-section show where some of the zones have been perforated for production.

Computer-Drawn Structural Cross-Section
